SHIIP patient reporting enables health care providers to monitor their patients using key system metrics.
Patient Reporting - Risk Indicators and Profile Scores
SHIIP presents the patient risk indicators and profile scores in a variety of ways.
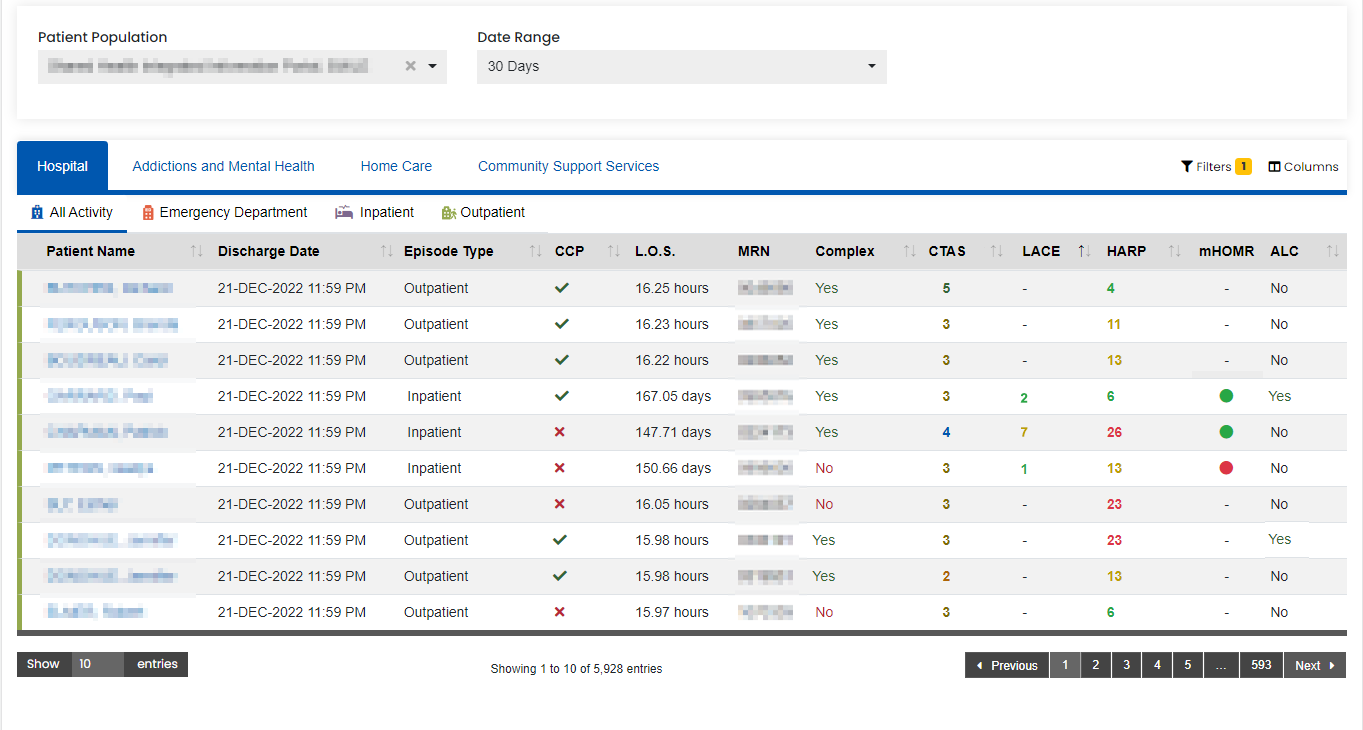
Recent Activity Page
For the selected patient population, presentation of the complex flag, HARP, LACE, mHOMR, CTAS and ALC indicators are available on the Recent Activity screen for hospital visits.
Click to see details
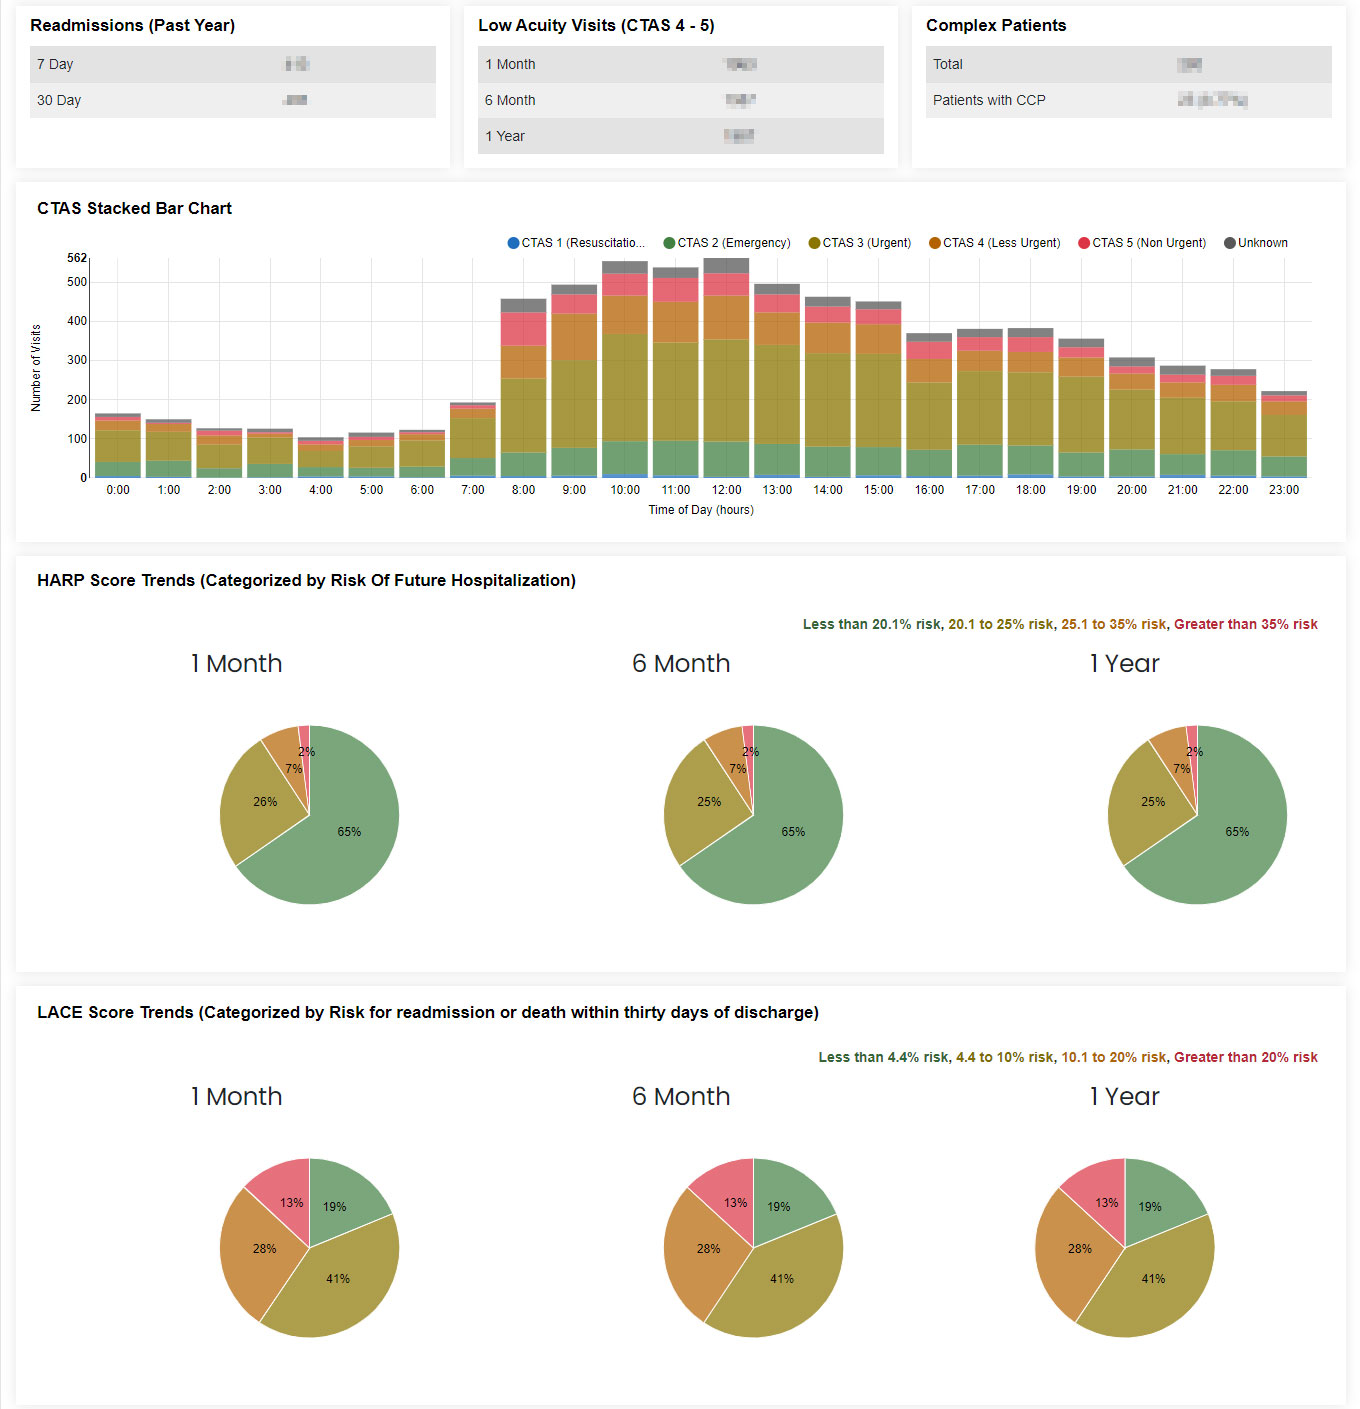
Dashboard Indicators
For the selected patient population, date range and hospital site, CTAS, complex flags, HARP and LACE trends are presented.
Click to see details
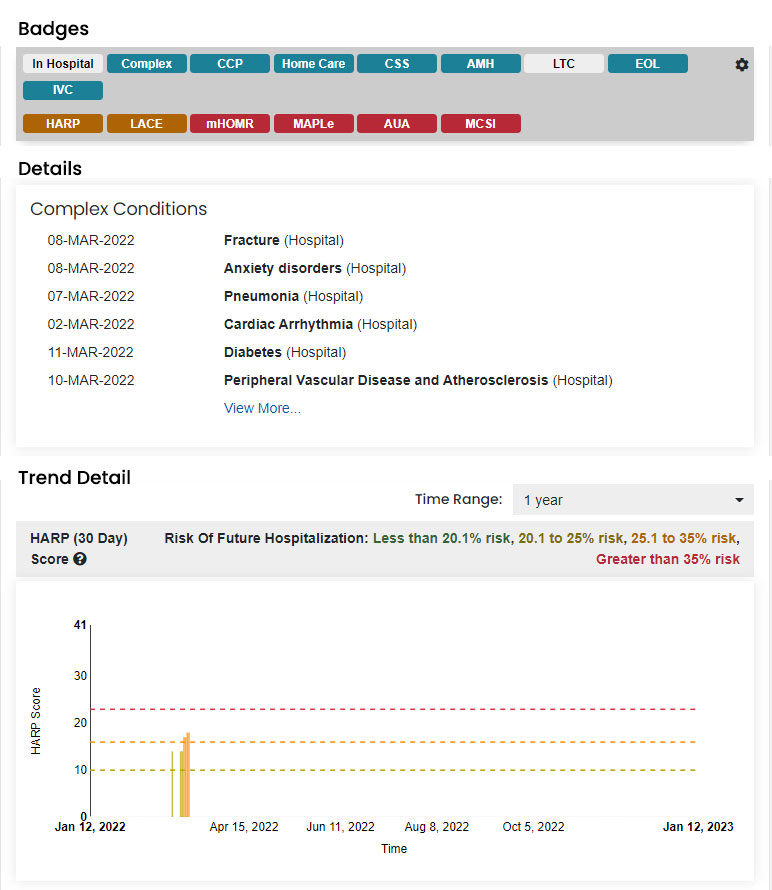
Patient Chart
The patient chart presents fulsome detail regarding the patients associated risk and profile scores and is presented in a variety of ways: badges, details, and trend detail.
Click to see details
SHIIP dashboards are customized to track six different metrics, each dashboard provides real-time metrics that help you assess your patients. Any aggregated values can be drilled down to see the patients or episodes (visits) that contributed to the value.
The Hospital Activity dashboard contains three metrics: combined activity, inpatient, and emergency department. Metrics are broken down into four values:
The four values are available for the following metrics.
- Combined Activity
- Inpatient Activity
- Emergency Department Activity
The Indicators dashboard provides a visualization of your patients’ acute care activity. It contains several key indicators that can be used to identify trends.
- Readmissions within the past year (both 7-day and 30-day)
- Low acuity visits (1 months, 6 months, and 12 months)
- Complex patients and Complex patients with a Coordinated Care Plan
- CTAS chart (number of visits by time of day)
- HARP score trends (1 month, 6 months, 12 months)
- LACE score trends (1 month, 6 months, 12 months)
The Care Coordination dashboard contains four sections.
- Created Care Plans
- Patients Contacted for Care Coordination
- Care Coordination Main
- Patients Discharged From Care Coordination
The hospital surge monitor is used by hospitals and health care facilities to monitor and manage patient flow and capacity during times of increased demand, the goal of a hospital surge monitor is to help ensure that patients receive timely and appropriate care, while also minimizing the risk of overcrowding and other negative outcomes.
Hospital surge monitors can be useful in helping hospitals and health care facilities prepare for and respond to increased demand, and can help ensure that patients receive the care they need in a timely and efficient manner.
SHIIP Hospital surge monitors track three metrics:
- Hospital Bed Occupancy
- Hospital Available Beds
- Hospital Operational Beds
The data contributions dashboard is used to track and visualize the data that is being contributed to SHIIP. It is typically used to monitor the flow of data into SHIIP and to identify any potential issues or challenges that may be impacting the quality or completeness of the data.
There are three different types of health care data contributors in SHIIP:
- Hospital
- Community Support Service (CSS)
- Home Care
Recent Activity Page Modal
For the selected patient population, presentation of the complex flag, HARP, LACE, mHOMR, CTAS and ALC indicators are available on the Recent Activity screen for hospital visits.
Recent Activity Page Modal
For the selected patient population, date range and hospital site, CTAS, complex flags, HARP and LACE trends are presented.
Patient Chart
The patient chart presents fulsome detail regarding the patients associated risk and profile scores and is presented in a variety of ways: badges, details, and trend detail.